Section 2.2 : Graphs of Trig Functions
There is not a whole lot to this section. It is here just to remind you of the graphs of the six trig functions as well as a couple of nice properties about trig functions.
Before jumping into the problems remember we saw in the Trig Function Evaluation section that trig functions are examples of periodic functions. This means that all we really need to do is graph the function for one periods length of values then repeat the graph.
Graph the following function. Show All Solutions Hide All Solutions
- \(y = \cos \left( x \right)\)
Show Solution
There really isn’t a whole lot to this one other than plotting a few points between 0 and \(2\pi \), then repeat. Remember cosine has a period of \(2\pi \) (see Problem 5 in Trig Function Evaluation).
Here’s the graph for \( - 4\pi \le x \le 4\pi \).
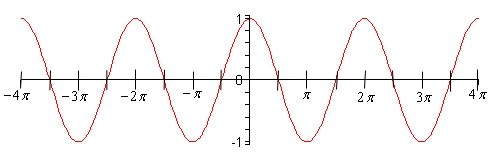
Notice that graph does repeat itself 4 times in this range of \(x\)’s as it should.
Let’s also note here that we can put all values of \(x\) into cosine (which won’t be the case for most of the trig functions) and let’s also note that
\[ - 1 \le \cos \left( x \right) \le 1\]It is important to notice that cosine will never be larger than 1 or smaller than -1. This will be useful on occasion in a calculus class.
- \(y = \cos \left( {2x} \right)\)
Show Solution
We need to be a little careful with this graph. \(\cos \left( x \right)\) has a period of \(2\pi \), but we’re not dealing with \(\cos \left( x \right)\) here. We are dealing with \(\cos \left( {2x} \right)\). In this case notice that if we plug in \(x = \pi \) we will get
\[\cos \left( {2\left( \pi \right)} \right) = \cos \left( {2\pi } \right) = \cos \left( 0 \right) = 1\]In this case the function starts to repeat itself after \(\pi \) instead of \(2\pi \)! So, this function has a period of \(\pi \). So, we can expect the graph to repeat itself 8 times in the range \( - 4\pi \le x \le 4\pi \). Here is that graph.
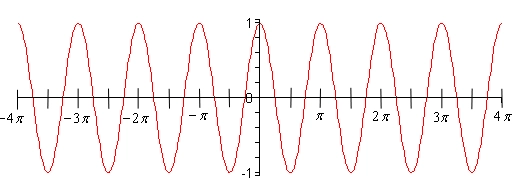
Sure enough, there are twice as many cycles in this graph.
In general, we can get the period of \(\cos \left( {\omega \,x} \right)\) using the following.
\[{\rm{Period}} = \frac{{2\pi }}{\omega }\]If \(\omega > 1\) we can expect a period smaller than \(2\pi \) and so the graph will oscillate faster. Likewise, if \(\omega < 1\) we can expect a period larger than \(2\pi \) and so the graph will oscillate slower.
Note that the period does not affect how large cosine will get. We still have
\[ - 1 \le \cos \left( {2x} \right) \le 1\] - \(y = 5\cos \left( {2x} \right)\)
Show Solution
In this case I added a 5 in front of the cosine. All that this will do is increase how big cosine will get. The number in front of the cosine or sine is called the amplitude. Here’s the graph of this function.
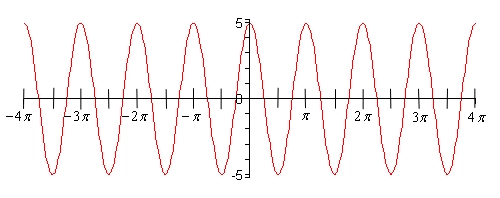
Note the scale on the \(y\)-axis for this problem and do not confuse it with the previous graph. The \(y\)-axis scales are different!
In general,
\[ - R \le R\cos \left( {\omega \,x} \right) \le R\] - \(y = \sin \left( x \right)\)
Show Solution
As with the first problem in this section there really isn’t a lot to do other than graph it. Here is the graph on the range \( - 4\pi \le x \le 4\pi \).
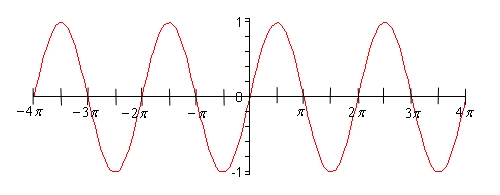
From this graph we can see that sine has the same range that cosine does. In general
\[ - R \le R\sin \left( {\omega \,x} \right) \le R\]As with cosine, sine itself will never be larger than 1 and never smaller than -1.
- \(\displaystyle y = \sin \left( {\frac{x}{3}} \right)\)
Show Solution
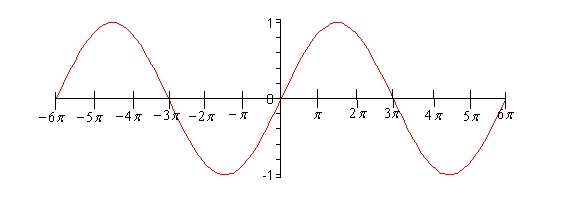
So, in this case we don’t have just an \(x\) inside the parenthesis. Just as in the case of cosine we can get the period of \(\sin \left( {\omega \,x} \right)\) by using
\[\text{Period}=\frac{2\pi }{\omega }=\frac{2\pi }{{}^{1}/{}_{3}}=6\pi \]In this case the curve will repeat every \(6\pi \). So, for this graph I’ll change the range to \( - 6\pi \le x \le 6\pi \) so we can get at least two traces of the curve showing. Here is the graph.
- \(y = \tan \left( x \right)\)
Show Solution
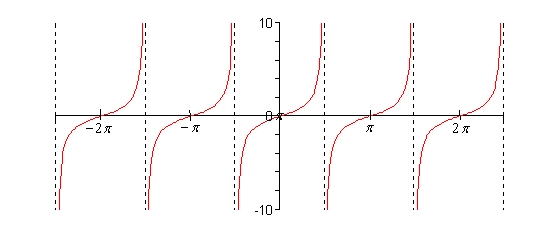
In the case of tangent, we have to be careful when plugging \(x\)’s in since tangent doesn’t exist wherever cosine is zero (remember that \(\tan x = \frac{{\sin x}}{{\cos x}}\)). Tangent will not exist at
\[x = \cdots , - \frac{{5\pi }}{2}, - \frac{{3\pi }}{2}, - \frac{\pi }{2},\frac{\pi }{2},\frac{{3\pi }}{2},\frac{{5\pi }}{2}, \ldots \]and the graph will have asymptotes at these points. Here is the graph of tangent on the range \( - \frac{{5\pi }}{2} < x < \frac{{5\pi }}{2}\).
Finally, a couple of quick properties about \(R\tan \left( {\omega \,x} \right)\).
\[\begin{array}{c} - \infty < R\tan \left( {\omega \,x} \right) < \infty \\ {\rm{Period}} = \displaystyle \frac{\pi }{\omega }\end{array}\]For the period remember that \(\tan \left( x \right)\) has a period of \(\pi \) unlike sine and cosine and that accounts for the absence of the 2 in the numerator that was there for sine and cosine.
- \(y = \sec \left( x \right)\)
Show Solution
As with tangent we will have to avoid \(x\)’s for which cosine is zero (remember that \(\sec x = \frac{1}{{\cos x}}\)). Secant will not exist at
\[x = \cdots , - \frac{{5\pi }}{2}, - \frac{{3\pi }}{2}, - \frac{\pi }{2},\frac{\pi }{2},\frac{{3\pi }}{2},\frac{{5\pi }}{2}, \ldots \]and the graph will have asymptotes at these points. Here is the graph of secant on the range \( - \frac{{5\pi }}{2} < x < \frac{{5\pi }}{2}\).
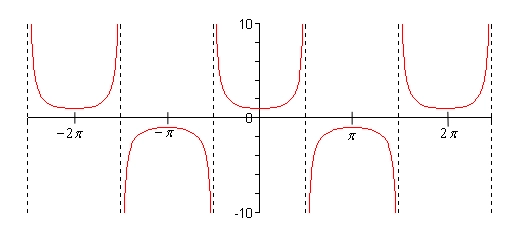
Notice that the graph is always greater than 1 or less than -1. This should not be terribly surprising. Recall that \( - 1 \le \cos \left( x \right) \le 1\). So, 1 divided by something less than 1 will be greater than 1. Also, \({1}/{\pm 1}=\pm 1\) and so we get the following ranges out of secant.
\[R\sec \left( {\omega \,x} \right) \ge R\hspace{0.5in}{\rm{and}}\hspace{0.55in}R\sec \left( {\omega \,x} \right) \le - R\] - \(y = \csc \left( x \right)\)
Show Solution
For this graph we will have to avoid \(x\)’s where sine is zero \(\left( {\csc x = \frac{1}{{\sin x}}} \right)\). So, the graph of cosecant will not exist for
\[x = \cdots , - 2\pi , - \pi ,0,\pi ,2\pi , \cdots \]Here is the graph of cosecant.
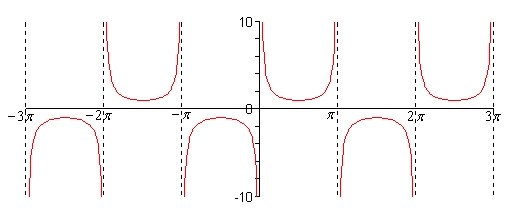
Cosecant will have the same range as secant.
\[R\csc \left( {\omega \,x} \right) \ge R\hspace{0.5in}{\rm{and}}\hspace{0.5in}R\csc \left( {\omega \,x} \right) \le - R\] - \(y = \cot \left( x \right)\)
Show Solution
Cotangent must avoid
\[x = \cdots , - 2\pi , - \pi ,0,\pi ,2\pi , \cdots \]since we will have division by zero at these points. Here is the graph.
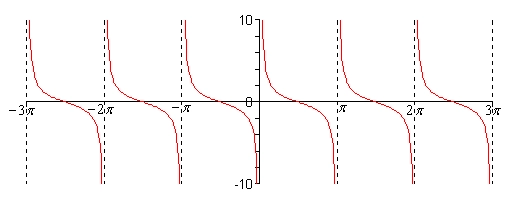
Cotangent has the following range.
\[ - \infty < R\cot \left( {\omega \,x} \right) < \infty \]