Section 4.6 : Transformations
In this section we are going to see how knowledge of some fairly simple graphs can help us graph some more complicated graphs. Collectively the methods we’re going to be looking at in this section are called transformations.
Vertical Shifts
The first transformation we’ll look at is a vertical shift.
Given the graph of \(f\left( x \right)\) the graph of \(g\left( x \right) = f\left( x \right) + c\) will be the graph of \(f\left( x \right)\) shifted up by \(c\) units if \(c\) is positive and or down by \(c\) units if \(c\) is negative.
So, if we can graph \(f\left( x \right)\) getting the graph of \(g\left( x \right)\) is fairly easy. Let’s take a look at a couple of examples.
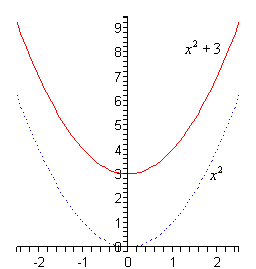
- \(g\left( x \right) = {x^2} + 3\)
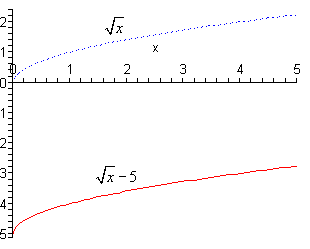
- \(f\left( x \right) = \sqrt x - 5\)
The first thing to do here is graph the function without the constant which by this point should be fairly simple for you. Then shift accordingly.
a \(g\left( x \right) = {x^2} + 3\) Show Solution
In this case we first need to graph \({x^2}\) (the dotted line on the graph below) and then pick this up and shift it upwards by 3. Coordinate wise this will mean adding 3 onto all the \(y\) coordinates of points on \({x^2}\).
Here is the sketch for this one.
b \(f\left( x \right) = \sqrt x - 5\) Show Solution
Okay, in this case we’re going to be shifting the graph of \(\sqrt x \) (the dotted line on the graph below) down by 5. Again, from a coordinate standpoint this means that we subtract 5 from the \(y\) coordinates of points on \(\sqrt x \).
Here is this graph.
So, vertical shifts aren’t all that bad if we can graph the “base” function first. Note as well that if you’re not sure that you believe the graphs in the previous set of examples all you need to do is plug a couple values of \(x\) into the function and verify that they are in fact the correct graphs.
Horizontal Shifts
These are fairly simple as well although there is one bit where we need to be careful.
Given the graph of \(f\left( x \right)\) the graph of \(g\left( x \right) = f\left( {x + c} \right)\) will be the graph of \(f\left( x \right)\) shifted left by \(c\) units if \(c\) is positive and or right by \(c\) units if \(c\) is negative.
Now, we need to be careful here. A positive \(c\) shifts a graph in the negative direction and a negative \(c\) shifts a graph in the positive direction. They are exactly opposite than vertical shifts and it’s easy to flip these around and shift incorrectly if we aren’t being careful.
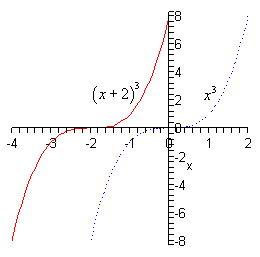
- \(h\left( x \right) = {\left( {x + 2} \right)^3}\)
- \(g\left( x \right) = \sqrt {x - 4} \)
Okay, with these we need to first identify the “base” function. That is the function that’s being shifted. In this case it looks like we are shifting \(f\left( x \right) = {x^3}\). We can then see that,
\[h\left( x \right) = {\left( {x + 2} \right)^3} = f\left( {x + 2} \right)\]In this case \(c = 2\) and so we’re going to shift the graph of \(f\left( x \right) = {x^3}\) (the dotted line on the graph below) and move it 2 units to the left. This will mean subtracting 2 from the \(x\) coordinates of all the points on \(f\left( x \right) = {x^3}\).
Here is the graph for this problem.
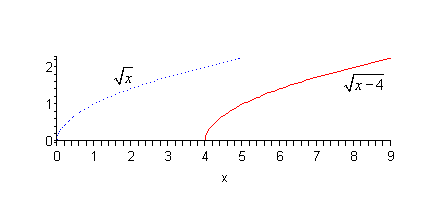
b \(g\left( x \right) = \sqrt {x - 4} \) Show Solution
In this case it looks like the base function is \(\sqrt x \) and it also looks like \(c = - 4\) and so we will be shifting the graph of \(\sqrt x \) (the dotted line on the graph below) to the right by 4 units. In terms of coordinates this will mean that we’re going to add 4 onto the \(x\) coordinate of all the points on \(\sqrt x \).
Here is the sketch for this function.
Vertical and Horizontal Shifts
Now we can also combine the two shifts we just got done looking at into a single problem. If we know the graph of \(f\left( x \right)\) the graph of \(g\left( x \right) = f\left( {x + c} \right) + k\) will be the graph of \(f\left( x \right)\) shifted left or right by \(c\) units depending on the sign of \(c\) and up or down by \(k\) units depending on the sign of \(k\).
Let’s take a look at a couple of examples.
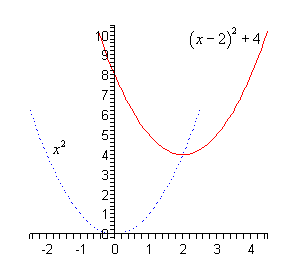
- \(f\left( x \right) = {\left( {x - 2} \right)^2} + 4\)
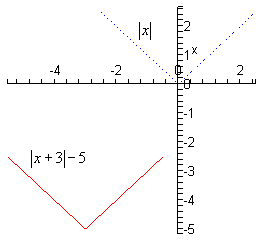
- \(g\left( x \right) = \left| {x + 3} \right| - 5\)
In this part it looks like the base function is \({x^2}\) and it looks like will be shift this to the right by 2 (since \(c = - 2\)) and up by 4 (since \(k = 4\)). Here is the sketch of this function.
b \(g\left( x \right) = \left| {x + 3} \right| - 5\) Show Solution
For this part we will be shifting \(\left| x \right|\) to the left by 3 (since \(c = 3\)) and down 5 (since \(k = - 5\)). Here is the sketch of this function.
Reflections
The final set of transformations that we’re going to be looking at in this section aren’t shifts, but instead they are called reflections and there are two of them.
Reflection about the \(x\)-axis
Given the graph of \(f\left( x \right)\) then the graph of \(g\left( x \right) = - f\left( x \right)\) is the graph of \(f\left( x \right)\) reflected about the \(x\)-axis. This means that the signs on the all the \(y\) coordinates are changed to the opposite sign.
Reflection about the \(y\)-axis
Given the graph of \(f\left( x \right)\) then the graph of \(g\left( x \right) = f\left( { - x} \right)\) is the graph of \(f\left( x \right)\) reflected about the \(y\)-axis. This means that the signs on the all the \(x\) coordinates are changed to the opposite sign.
Here is an example of each.
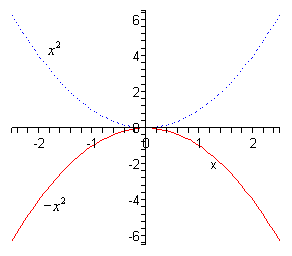
- \(g\left( x \right) = - {x^2}\)
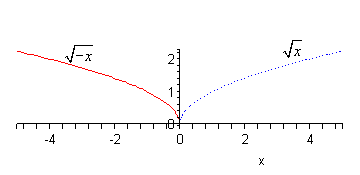
- \(h\left( x \right) = \sqrt { - x} \)
Based on the placement of the minus sign (i.e. it’s outside the square and NOT inside the square, or \({\left( { - x} \right)^2}\) ) it looks like we will be reflecting \({x^2}\) about the \(x\)-axis. So, again, the means that all we do is change the sign on all the \(y\) coordinates.
Here is the sketch of this graph.
b \(h\left( x \right) = \sqrt { - x} \) Show Solution
Now with this one let’s first address the minus sign under the square root in more general terms. We know that we can’t take the square roots of negative numbers, however the presence of that minus sign doesn’t necessarily cause problems. We won’t be able to plug positive values of \(x\) into the function since that would give square roots of negative numbers. However, if \(x\) were negative, then the negative of a negative number is positive and that is okay. For instance,
\[h\left( { - 4} \right) = \sqrt { - \left( { - 4} \right)} = \sqrt 4 = 2\]So, don’t get all worried about that minus sign.
Now, let’s address the reflection here. Since the minus sign is under the square root as opposed to in front of it we are doing a reflection about the \(y\)-axis. This means that we’ll need to change all the signs of points on \(\sqrt x \).
Note as well that this syncs up with our discussion on this minus sign at the start of this part.
Here is the graph for this function.